Success Charts: How to Present Them to A&R and Booking Teams
20 May 2026
In the music industry, collaboration decisions are increasingly based on data. A&R managers, who are responsible for finding and developing artists, and booking agents, who arrange live shows, look not only at the sound but also at the numbers that show your potential. Well-designed success charts help you communicate key metrics quickly and increase your chances of getting a deal or a better booking opportunity.
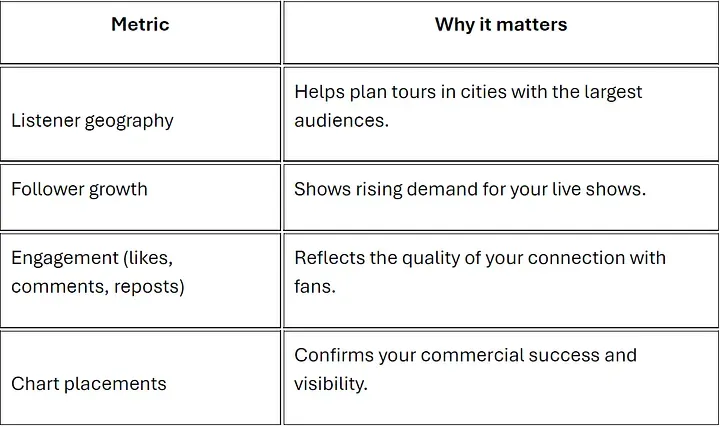
Which metrics matter for A&R and booking teams
For A&R managers, the key metrics are:
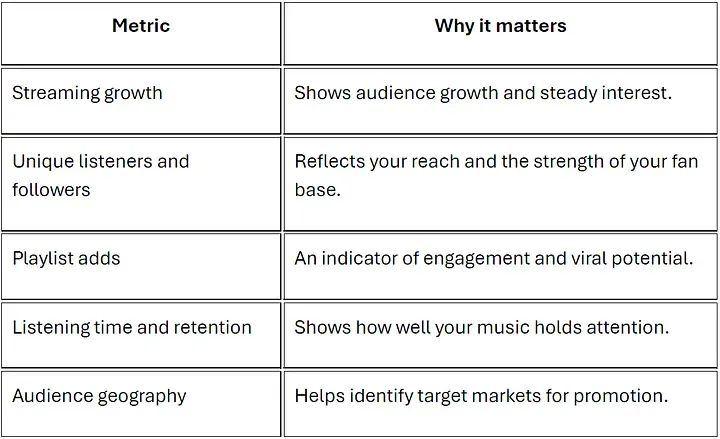
For booking agents, the critical metrics are:
How to visualize data effectively
- 1.Use line charts for trends, since they clearly show how your streams and followers grow over time.
- 2.Use maps for geography, because color-coding the regions with the highest listener concentration helps booking agents quickly identify tour stops.
- 3.Build dashboards with key metrics by combining 4–6 of the most important indicators on one page for a fast overview.
- 4.Add comparison periods to show growth over the last month, quarter, and year so the trend is easy to see.
- 5.Avoid clutter, because one chart should answer one question. Do not try to fit every metric on one slide.
Where to get the data
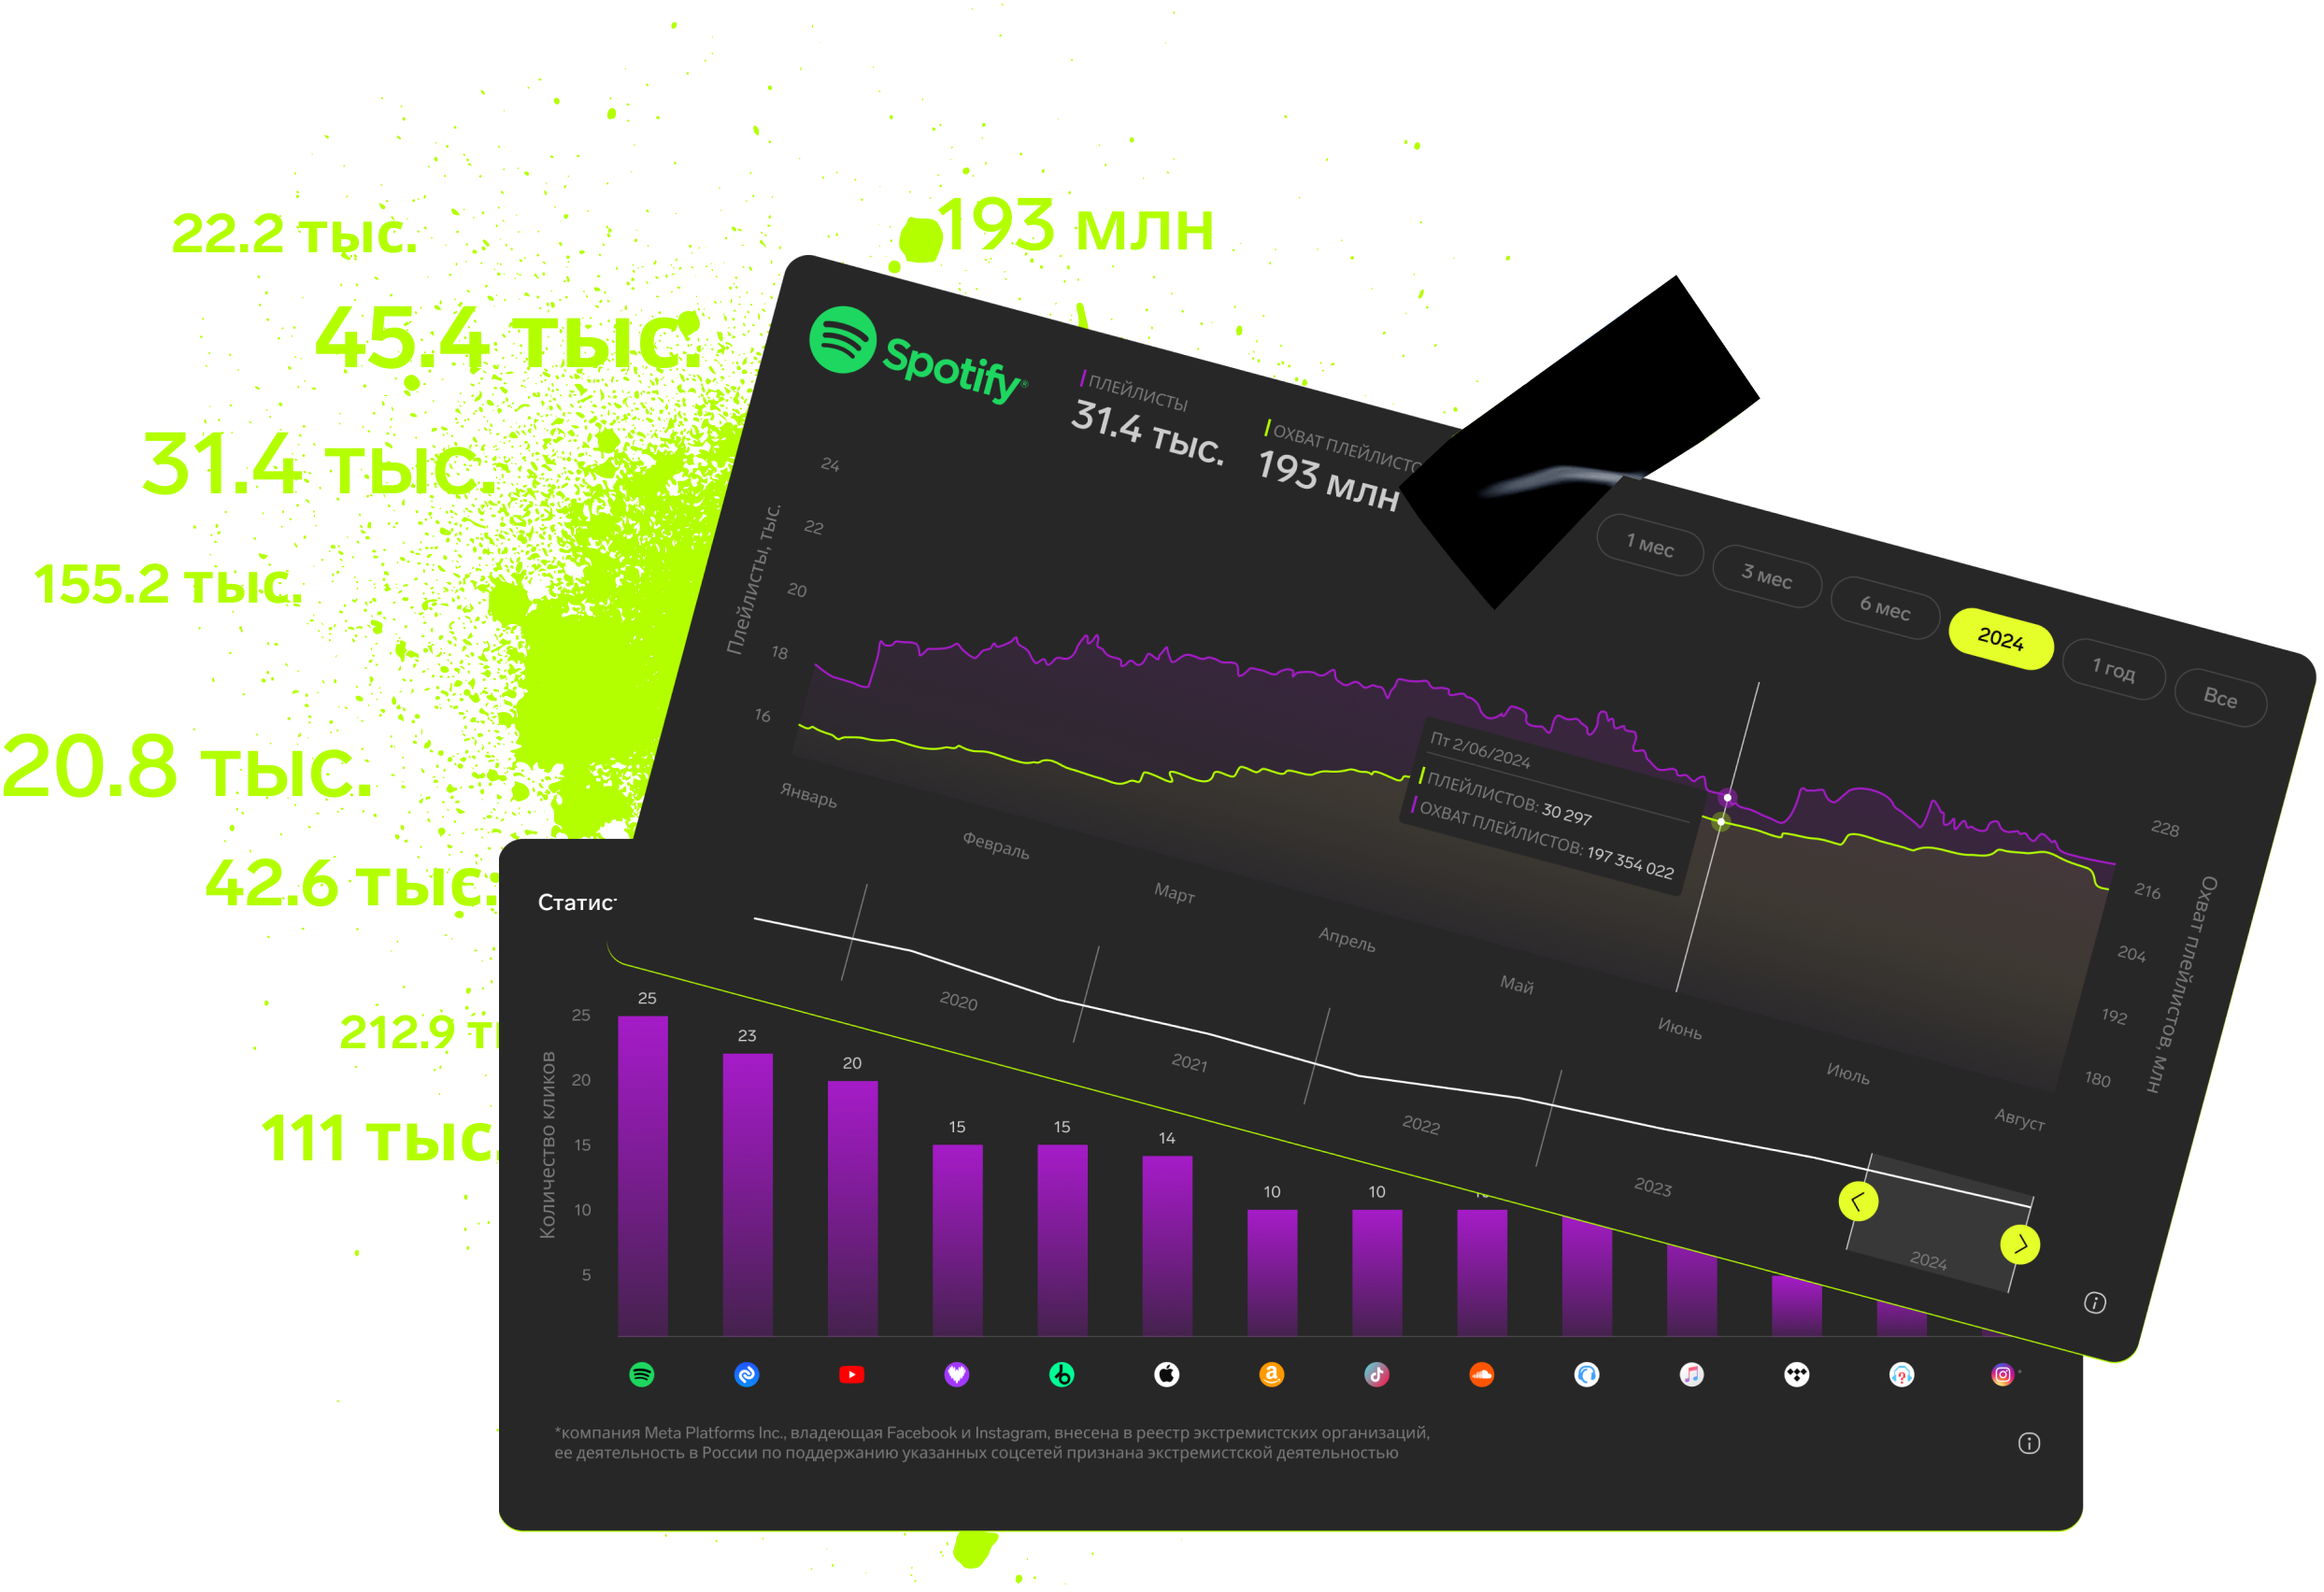
For analyzing key metrics from most music platforms, it is convenient to use Rifify, which gathers all your indicators in one place: streams, geography, engagement, and playlist adds. Regular monitoring through a tool like this helps you make better promotion decisions and share up-to-date stats with your team.
Practical advice
- Prepare a short presentation of 5–7 slides with the main charts before meeting with A&R or a booking agent.
- Add context by briefly explaining next to the numbers which actions led to the growth, such as promotion, playlisting, or touring.
- Be ready for questions by thinking ahead about trends, spikes, and dips in the charts.
- Update your data regularly, because current information shows that you are actively working on your career growth.
Well-presented success charts turn an abstract “we are growing” into concrete proof of your potential. That builds trust with the industry and speeds up collaboration decisions.
Subscription includes

Detailed track analytics
AI assistant
Real-time activity feed
Notifications about new streams, playlists and mentions
Automatically imported catalog
Pricing
Choose the right option and find out the final price
Maximum number of artists
Subscription duration
Total
$
Monthly cost per artist
$
By clicking the «Proceed to payment» button, you agree to the Privacy Policy
Couldn’t find the right option?